
Recently, we received reports from users that WorkAdventure made their computers overheat and their fans spin. We take energy consumption seriously. We have already spent a lot of time optimizing the performance of WorkAdventure, by tweaking the rendering engine to make sure no unnecessary computations are done: if nothing happens on the map, the game engine behind WorkAdventure (Phaser) does not perform any updates.
Yet, some users still reported that their computers were overheating. After some investigation, I realized all those users were sharing the same map template, and that this template contained animations.
Understanding the game engine
The game engine behind WorkAdventure is called Phaser. By default, it runs at the refresh rate of the screen (usually 60Hz). This means that the game engine redraws everything you see on the screen 60 times per second. This is a lot of work for the computer, and it consumes some energy.
With WorkAdventure, we already applied some optimizations to reduce the energy consumption of the game engine. In a typical WorkAdventure map, movement of the users is rare. Users move when they visit one another, or when they walk around the map. But most of the time, users are just standing still, either in a meeting room, or in front of their desk. If absolutely nothing happens on the map, we don’t need to redraw the screen. So we implemented a mechanism that detects when nothing happens on the map, and skips rendering altogether. This is a huge energy saver. However, if anything happens on the map, the game engine will redraw the whole map. Even if the only thing that happens is one Woka moving a few pixels, or… an animation playing in the background.
Measuring the energy consumption of animations
To measure the impact of animations, I could have used CPU usage of the browser. However, most of the time, it’s the GPU that does the drawing, so CPU usage is not always a direct proxy for your laptop getting hot.
Instead, I used a tool called Powertop. It’s a Linux tool that measures the energy consumption of your computer and how fast your battery is draining.
I turned on Powertop, unplugged my test laptop (a Dell XPS 15 9560), set the screen brightness to the lowest possible level and opened a WorkAdventure map with animations. Then, I ticked the “Disable map animations” setting and took another measurement. I repeated this process several times to make sure my results were consistent.
First results:
| Without animations | With animations |
|---|---|
| ~7.5W | ~9.8W |
Note: Powertop measures the energy consumption of the whole computer, not just the browser. So the numbers above are not absolute. They may vary depending on what the computer is doing in the background. I estimate the margin of error at about 0.5W. But the difference is clear: animations are consuming more energy.
Is it bad?
Running applications consumes energy. The question is: is it worth it?
This is a subjective question. Everyone will have a different answer. Here is mine:
- If you are using WorkAdventure for a virtual event, where participants are just visiting the map for a few hours, then animations are probably not a big deal. They make the experience fun. Furthermore, in an event, participants are usually moving around the map, so the game engine will be redrawing the screen anyway.
- If you are using WorkAdventure for a virtual office, where participants are spending several hours a day, then you might want to use a map without animations, as when you are in a meeting, the game engine alone will cause your laptop battery to drain 30% faster!
Note: WorkAdventure renders nothing when the browser tab is hidden, so if you have WorkAdventure open in the background and are not looking at it, the game engine will not trigger and not consume any energy.
Optimizing your map while keeping animations
Do you want to keep animations in your map, but still want to reduce the energy consumption?
Here are some tips and things you need to know.
Note: animations are global. It does not matter whether your animations are displayed on the screen or hidden. Even if your viewport is zoomed in on a small part of the map without any animated tiles, as soon as there is one animated tile anywhere on the map, the game engine will redraw the whole map when the animation is fired.
If you have only one small animation in a giant map, maybe you can reconsider and remove it.
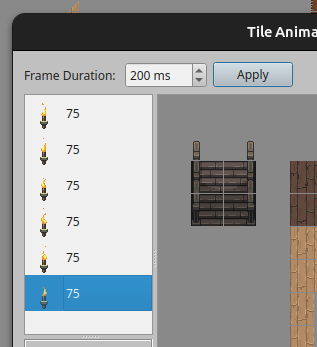
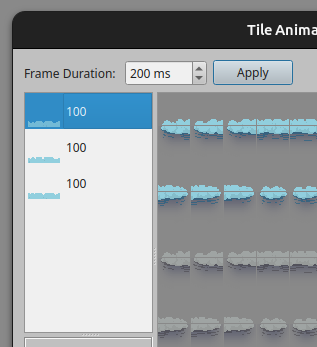
In the case where you have several animations and you want to keep them, try synchronizing your animations. In Tiled, you can set the duration of a frame of an animation in milliseconds.
The worst case scenario is when you have several animations with different durations.
Take a look at the example below. The fire animation runs at 75ms per frame, while the water animation runs at 100ms per frame.
|
|
|
This is bad. At T0, the map is drawn.
At T0 + 75ms, the fire animation triggers a draw.
At T0 + 100ms, the water animation triggers a draw.
At T0 + 150ms, the fire animation triggers a draw.
At T0 + 200ms, the water animation triggers a draw.
At T0 + 225ms, the fire animation triggers a draw.
At T0 + 300ms, both animations change frame at the same time: one draw.
Then the cycle starts again.
That’s 6 redraws every 300ms. If instead, you use the same duration for all animations, for example 100ms, then the map will be redrawn only every 100ms: 3 redraws every 300ms. You halve the number of redraws, and therefore roughly halve the extra energy the animations cost.
I did the test in real life, with the same map:
| Without animations | With desynchronized animations | With synchronized animations |
|---|---|---|
| ~7.5W | ~9.8W | ~8.5W |
Woohoo! I more than halved the extra consumption caused by the animations, while keeping them!
That’s still a 13% increase in energy consumption compared to a map without animations, but it’s a lot better than the 30% increase I had before.
Where is the energy going?
With my questions answered and the test bench still running, I did a few more tests, just for the sake of curiosity.
The energy consumption of the map is mostly due to the GPU. The GPU is doing a lot of work to redraw the map.
In terms of performance, the GPU is much more efficient than the CPU to do this drawing. Still, I was curious to see if the GPU was also more efficient in terms of energy consumption.
My question was: “What if I force the game engine to use the CPU instead of the GPU to draw the map? Would it be more energy efficient?”
So I did a test where I forced the game engine to use the CPU instead of the GPU to draw the map.
In WorkAdventure, you can do this by appending ?phaserMode=canvas to the URL of your map.
And I took some measurements, on the same map with synchronized animations:
| Baseline (no animations) | With GPU | With CPU |
|---|---|---|
| ~7.5W | ~8.5W | ~18.4W |
Holy moly! Where the GPU uses 1W to draw the map, the CPU uses 11W! Drawing on the CPU costs about 11 times more energy.
Conclusion
Tile animations in maps don’t come for free. They have a cost in energy consumption (at least as long as the browser tab is visible).
On my test laptop, animations increased power draw by 30%. By giving all animations the same frame duration, I brought that down to 13%. And if the browser falls back to drawing on the CPU, the same animations cost about 11 times more.
The cost is not huge, but if you are using WorkAdventure for a virtual office where participants are spending several hours a day, it can be noticeable. If you keep only one tip from this article: use the same frame duration for every animated tile in your map. And if an animation doesn’t earn its place, remove it.